“Kim vs. Comet” by Rachel Ciavarella

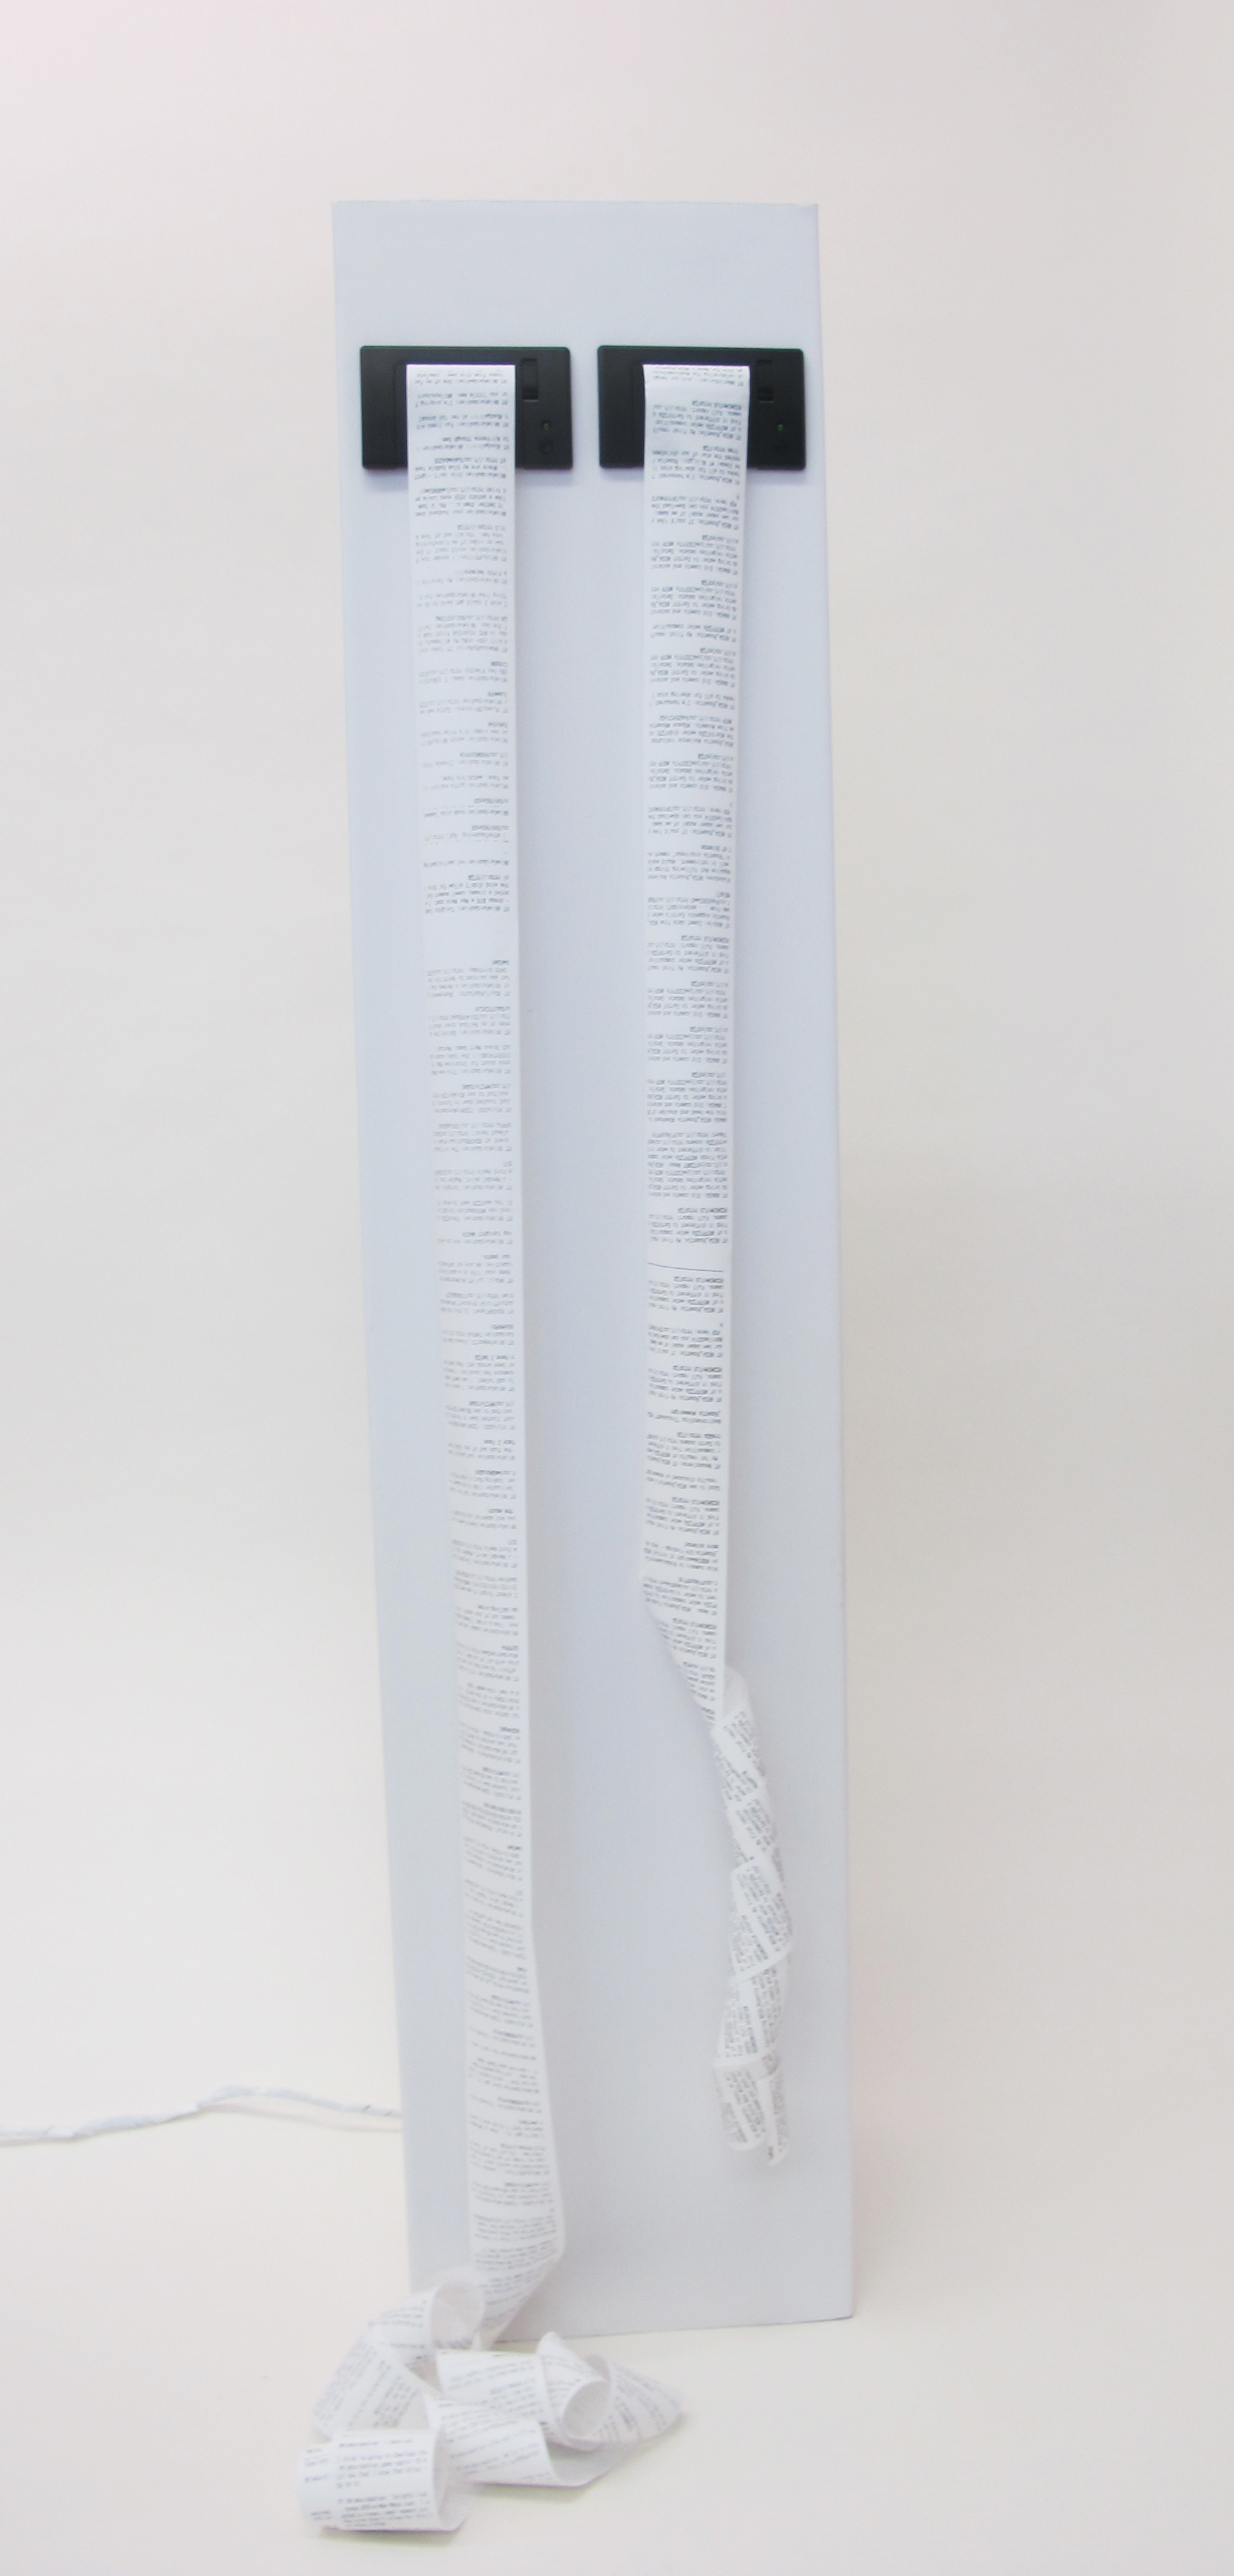
“Kim vs. Comet” is a real-time comparison of the volume of data created via social media about Kim Kardashian and the Rosetta comet landing.

How do online interactions differ from real world interactions? People often create digital personalities for themselves. These alternate selves make it easier to disassociate the physical self from their digital interactions. This mental distance can lead to uncharacteristic behavior in the digital world.

How does media influence public perception? Kim’s “internet breaking” magazine cover was published about the same time as scientists landed on the Rosetta comet. However, Kim seemed to get most of the media attention. Does that mean people care less about human’s landing on a comet? Or does the media only allow the public to see what it will get the most views and publicity off of?

This piece physicalizes the digital interaction of tweeting thereby forcing people to confront theirs and other’s digital interactions in the real world.

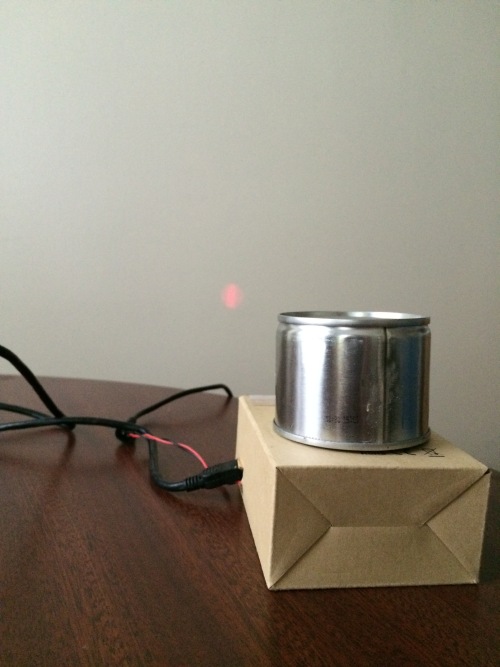
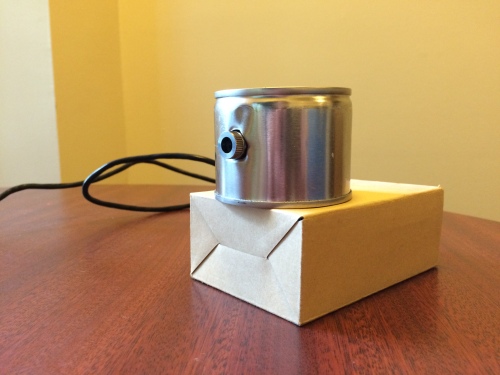
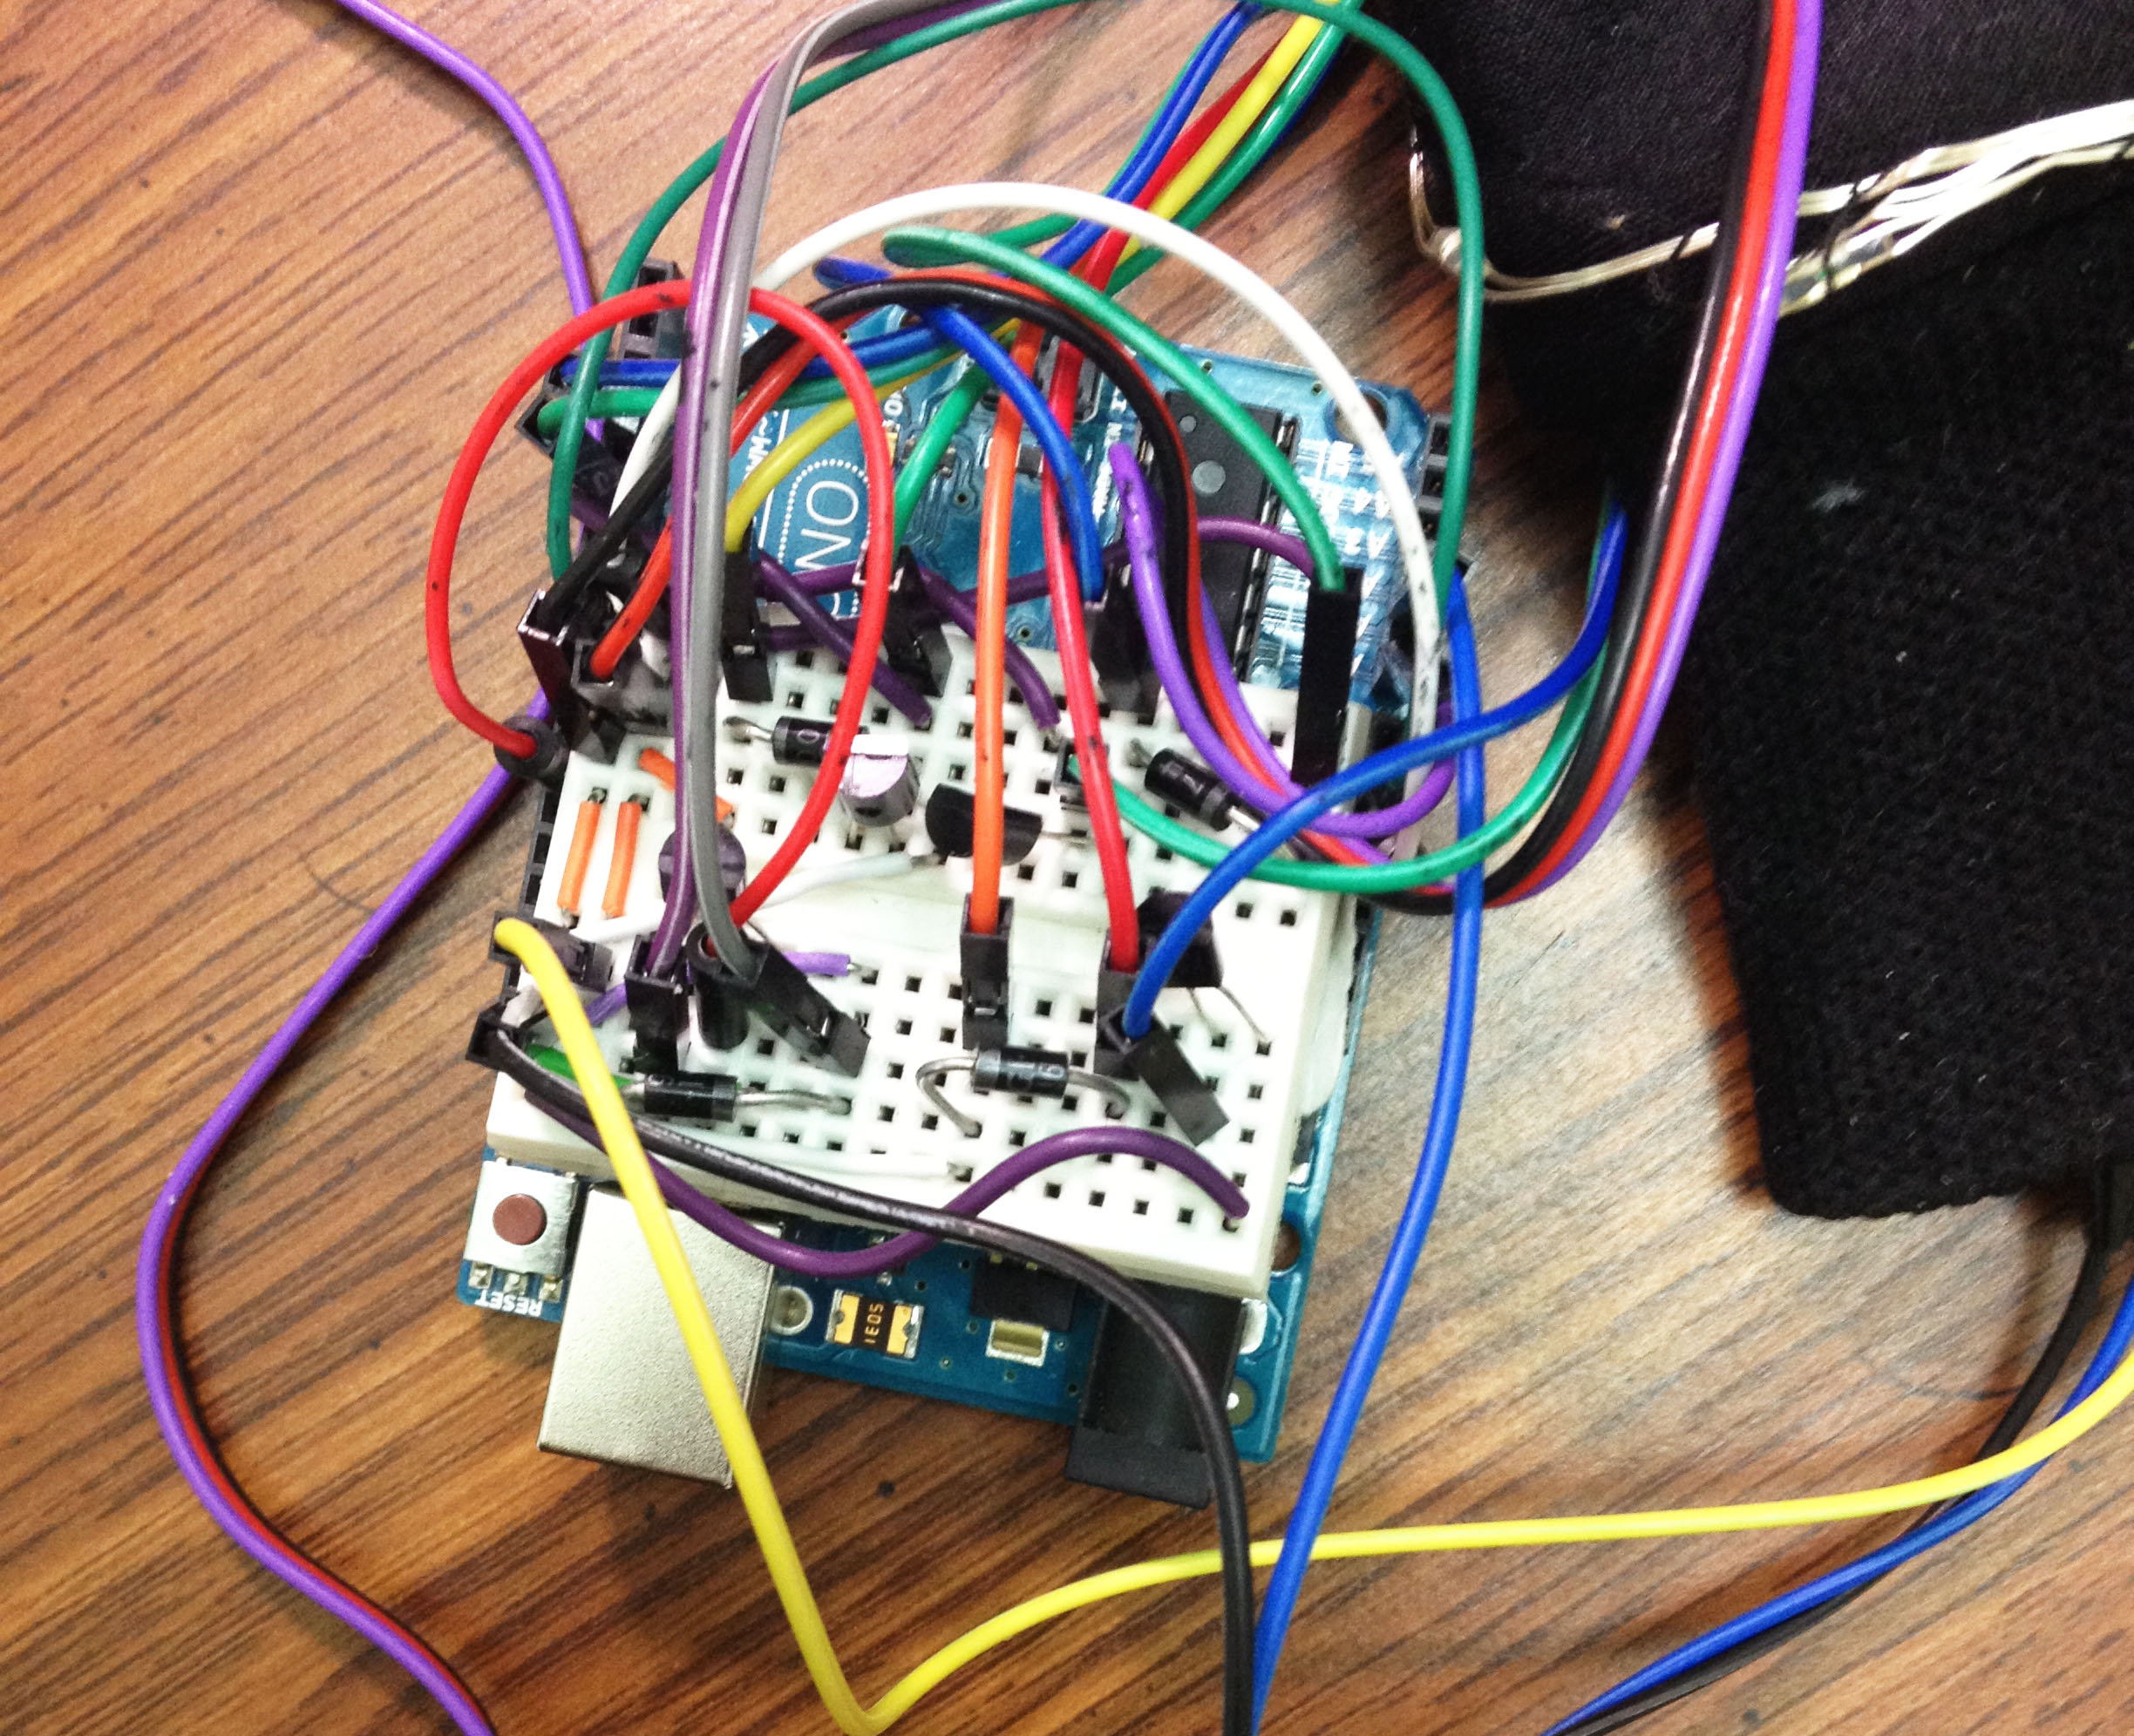
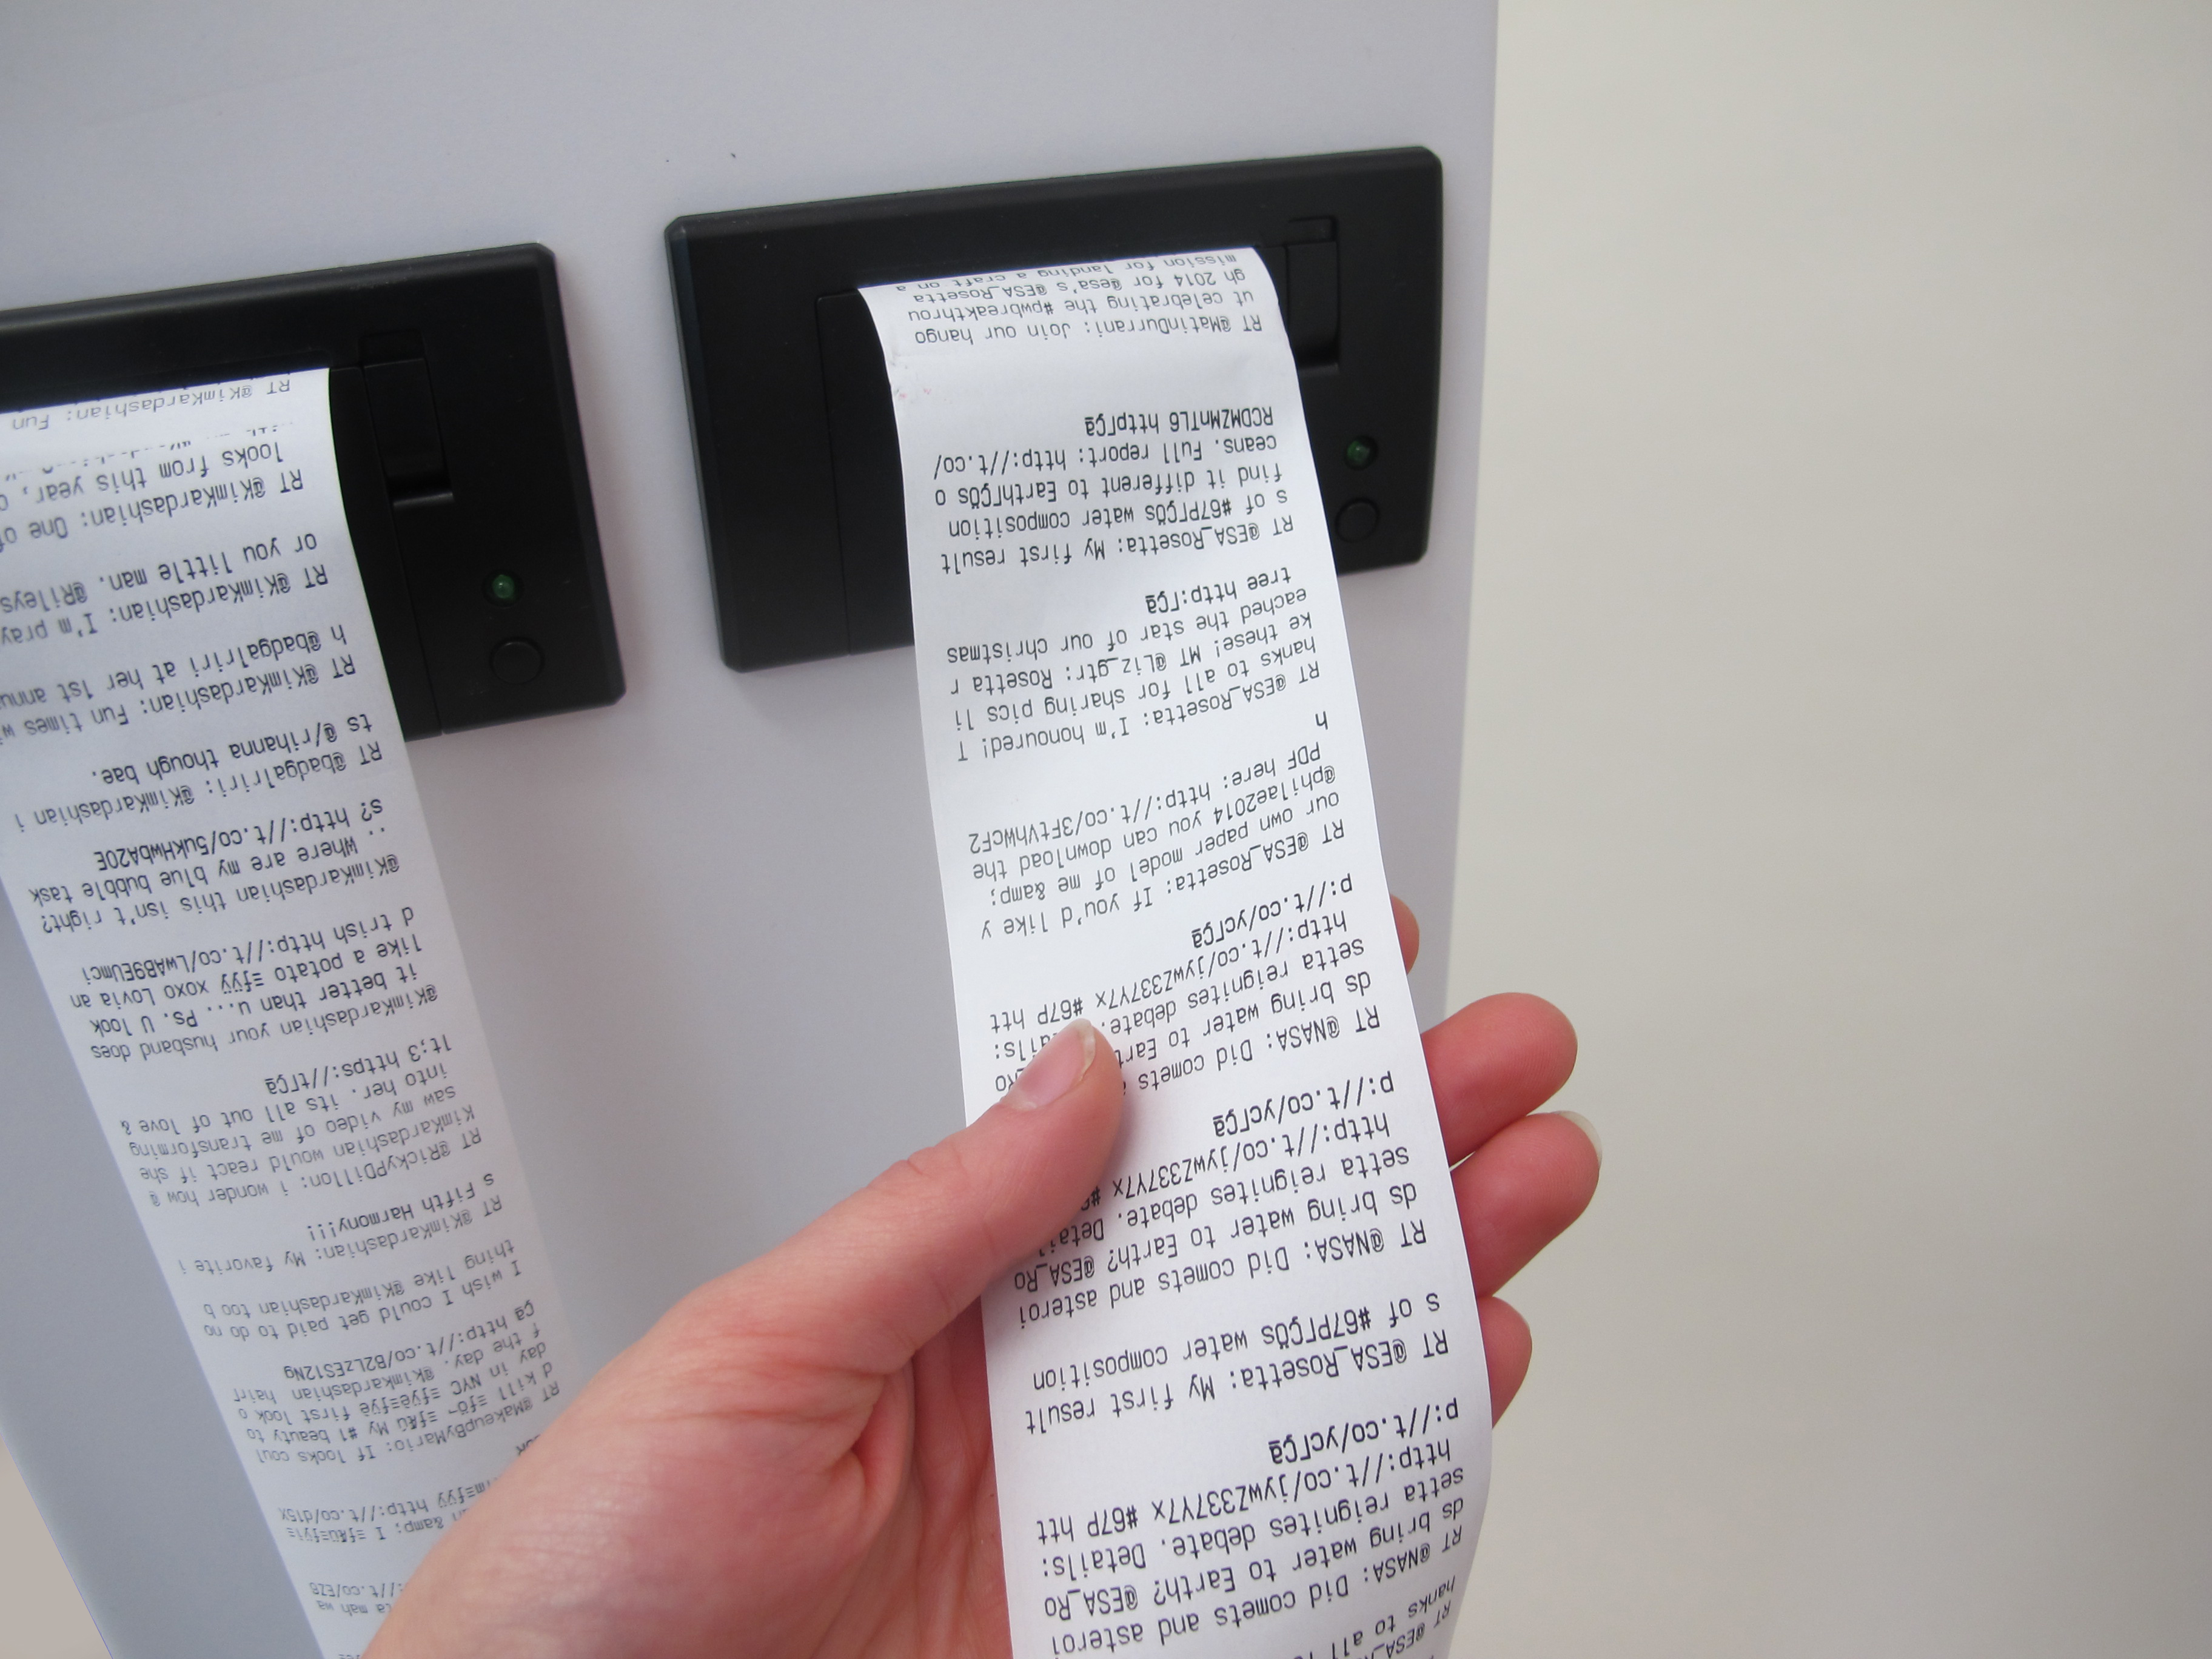
Inside the sculpture, there are two thermal printers, two arduinos and, a laptop running two processing sketches. The processing sketches scrape the most recent tweet from twitter matching the search query for either @KimKardashian or @ESA_Rosetta. The new tweets scraped are then compared to the previous tweet. If it is different it is printed out of one of the thermal printers. If it is the same as the previous tweet the sketch waits a few seconds (to avoid exceeding rate limits) and scrapes again for the most recent tweet of either query. The printed sheets are allowed to hang from the printers as a visual comparison of the volume of data created about either topic.

printer_frontfull

printer_hand

printer_bottom

In the future I would like to improve the piece by consolidating the electronics and code into one processing sketch and a raspberry pi.


“Rehab Touch” By Meng Shi (2014)

rehab touch from Meng Shi on Vimeo.

The idea of the final project is to explore some possible way to detect people’s gesture when they touch something.

Background:

Stroke affects the majority survivors’ abilities to live independently and their quality of life.

The rehabilitation in hospital is extremly expensive and cannot be covered by medical insurance.

What we are doing is to provide them possible low cost solution, which is a home-based rehabilitation system.

Touche:

www.disneyresearch.com/project/touche-touch-and-gesture-sensing-for-the-real-world/

Touch and activate:

dl.acm.org/citation.cfm?id=2501989

QQ20141216-1@2x


QQ20141216-2@2x

These two are using different way to realize gesture detection, touche is using capacitor change in the circuit while Touch and Activate is using frequency to detect frequency change.

My explore of these two based on two instructions:

Instructable: www.instructables.com/id/Touche-for-Arduino-Advanced-touch-sensing/

Ali: http://artfab.art.cmu.edu/touch-and-activate/


At first I explored “Touche”, and show it in critique,  after final critique, move to “touch and activate”.

QQ20141216-3@2x

In order to realize feedback, I connect Max and Processing to do visualization in processing, since it seems Max is not very good at data visualization part. (I didn’t find good lib to do data visualization in Max, maybe also because my limitation knowledge of Max.)


Limitation of system:

“Touch and Activate” seems not work very well in noising environment even it just use high frequency (like the final demo environment).

The connection between Max and Processing is not very strong. So if I want to do some complicated pattern, the signal is too weak to do that.


Immersive Experience: “Echo Chamber” by Connor Brem, Emma Steuer, Chris Williamson (2014)

In a dark room, words, motions, and even thoughts are amplified.

Echo Chamber places its audience inside a room where the only sound is the sound that they make, cycled through a audio feedback loop; and the only light is light that follows this sound’s pitch and volume.

Screen Shot 2014-12-16 at 9.12.21 PM

The piece places its audience unexpectedly in control of this room, and explores how they react. Do they explore its sounds and lights? Do they try to find order in the feedback? Or do they shrink back, afraid that the feedback will grow out of control?

Marea (2014)

Arduino,Data,Hardware,Submission — epicjefferson @ 5:58 pm

The tank’s water level reflects the water level on the coast of San Juan, PR.

By being susceptible to tsunami waves, Marea exposes Puerto Rico’s risky disregard for potential disaster.


“FbStalker” by Priya Ganadas (2014)

Have you ever stalked anyone on facebook?

Do you anticipate a comment or a like from ‘that’ specific person?

Do you constantly check your notifications and get disappointed and end up wasting too much time on fb for no reason?

What if you could get notification from Facebook if and only if that someone special was active?

fbstalker from Priya Ganadas on Vimeo.

FbStalker!!

It lets you pick your person that you want to get notified about as soon as they do any activity on your profile. A simple elegant light attached to desktop blinks to let you know that someone special just commented on your status.

IMG_0265

IMG_0270

I have tracked my friend Raj, I am printing ‘Wohoo’ every time i get a like from Raj.
IMG_0269

Serial communication is used between Processing to Arduino to blink the LED.

Back-end
I have used Temboo to get data from facebook.
Here is the link

You will have to get access from Facebook, using facebook developers

It was good learning to use temboo API without using the choreos and creating a custom code.

Github repository is here

“Ships to Sail the Void” by Connor Brem (2014)

Arduino,Python,Robotics,Software,Student Work — connorbrem @ 10:31 am

“When ships to sail the void between the stars have been built, there will step forth men to sail these ships.”

― Johannes Kepler

Satellites are funny things. It’s easy to forget how rapidly they circle the earth: it takes us a day to make a full rotation, but some satellites can complete an orbit in an hour and a half. At those speeds, reality is warped, and time bends.

What’s even stranger is that one of these satellites, the International Space Station, has people in it.

2014-10-17 09.03.39

“Ships to Sail the Void” plots the trajectory of the Space Station with a laser that it shines onto nearby surfaces. When it is activated, it takes a minute to show the path that the Space station will take over the next one hundred minutes.

Every time that it runs, it pulls fresh data from the satellite database at n2yo.

2014-10-17 09.02.42

It brings the strange, distant concept that is space travel down from the void, into your room.

“Flu Trend” by Meng (2014)

Arduino,Assignment,Data,Visual — meng @ 11:24 am

Flu Trend Data Visualization from Meng Shi on Vimeo.

date display

“Flu Trend” is a physical data visualization of flu in different city of USA. Data from Google ORG.

In this one, I choose Pittsburgh and San Diego. The brightness of LED light indicate the serious of the flu. With the date display on screen, we can understand when is the most serious time and we should go to health centre to get a vaccine.

Because I get a bad cold recent days, I hope it can help people to take care in this season (During the visualization, from Nov-Jan is the most serious period every year). It could work as a advertisement of health care centre or hospital, to encourage people to get a vaccine when necessary.

“Long Distance Whisper”

Arduino,Audio,Final Project,OpenCV,Sensors — epicjefferson @ 1:38 pm

Proposal: “Noise” by Connor Brem (2014)

Arduino,Audio,Final Project,Robotics,Sensors — connorbrem @ 11:09 pm

“Noise” will be a collaborative, physical music-looping device.

“Sensation.” by Amy Friedman (2014)

IMG_1247
IMG_1248
IMG_1239 IMG_1240

We constantly have stresses in our life that overwhelm us from time to time. We dont realize the impact our stressful lifestyle can have on our bodies and overall well being. Stress can induce heart problems, skin conditions, increased heart rate, depression, anxiety and more. People need to take moments to just breathe and learn how to relax for a few moments in times of pressure to maintain healthy living.

Sensation. measures your pulse and allows you to understand your heart palputations visually through a wearable lighting system. If your heart is beating over the healthy limit of beats per minute, embedded motors rotate to create a massage to sooth your stress and focus upon another task to lower your heart rate. Users of Sensation. can also manipulate the patterns of the massage by moving your finger over a position sensor. The device uses an Arduino, softpot Position sensor, 4 cellphone motors, string LEDs, and a pulse sensor.

Next Page »
This work is licensed under a Creative Commons Attribution-Noncommercial-Share Alike 3.0 Unported License.
(c) 2025 Hybrid Instrument Building | powered by WordPress with Barecity